Mermaid
How to add Mermaid charts and diagrams to your Doks website.
The Mermaid javascript library is quite large (minified 1.12 MB). For performance reasons, consider using Mermaid at build time (recommended).
At request time
Install
Install Mermaid: npm install mermaid -D.
Enable
Mermaid support is switched off per default. For performance reasons, the script is only loaded on pages that need it (so, not site wide). Activate it by setting mermaid = true in the front matter of a page.
Use shortcode
{{< mermaid class="bg-light text-center" >}}
graph TD
  A[Hard] -->|Text| B(Round)
  B --> C{Decision}
  C -->|One| D[Result 1]
  C -->|Two| E[Result 2]
{{< /mermaid >}}
Note that, you can add Bootstrap classes to the shortcode, for e.g. aligning the graph or setting the background color.
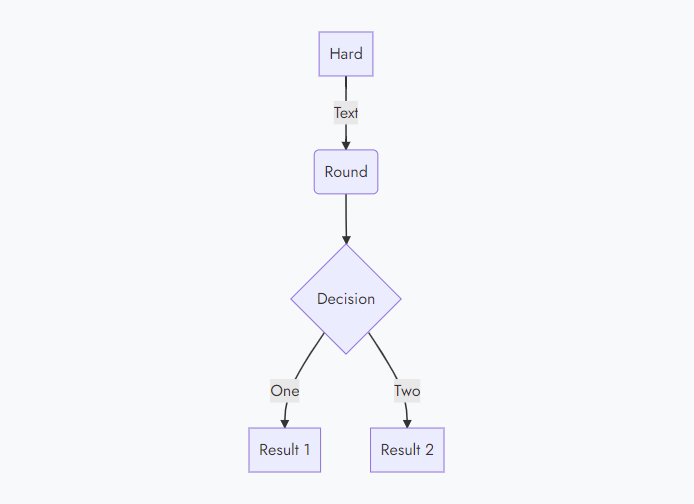
Note, this is an image, because Mermaid support is switched off on this site.
Use code fences
```mermaid
graph TD
  A[Hard] -->|Text| B(Round)
  B --> C{Decision}
  C -->|One| D[Result 1]
  C -->|Two| E[Result 2]
```
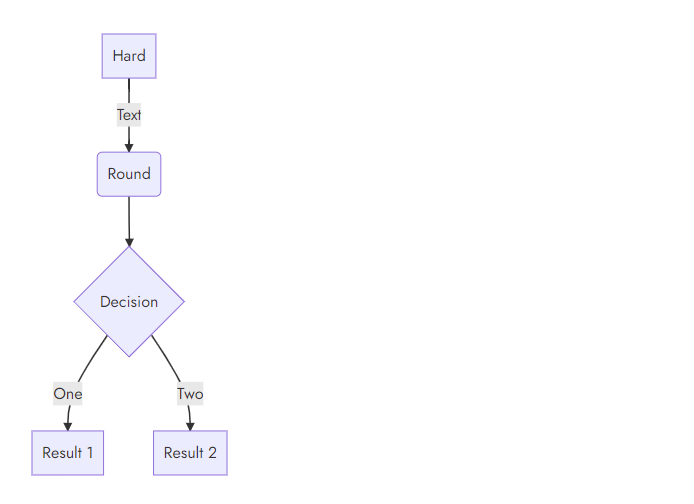 Note, this is an image, because Mermaid support is switched off on this site.
At build time
If you don’t need to generate charts and diagrams at request time, use the Mermaid Live Editor to generate charts and diagrams for use at build time.
Workflow
- Generate your chart /diagram in the Mermaid Live Editor
- Save the definition file (for future editing purposes) + png in your page bundle
- Insert the png in your page with the small image shortcode.
Usage
- Flowchart
- Sequence diagram
- Class diagram
- State diagram
- Entity Relationship Diagram
- User Journey Diagram
- Gantt chart
- Pie chart
- Requirement Diagram